
Get Tech Tips
Subscribe to get free tech tips.
Wet Bulb and Enthalpy – The Left Side of the Chart

It's incredibly useful to understand wet-bulb temperature and air enthalpy when calculating actual system capacity and human comfort. Dry-bulb temperature is a reading of the average molecular velocity of dry air. However, it does not account for the actual heat content of the air or the evaporative cooling effect of the air.
When air is at 100% relative humidity, the dry-bulb, wet-bulb, and dew point temperatures are all the same. At 100% relative humidity, the air is completely saturated with moisture and can have no evaporative effect.
When air is less than 100% RH, it will provide an evaporative cooling effect, and the wet-bulb temperature is a measurement of that effect. In fact, wet-bulb temperature is the temperature a damp thermometer bulb will read when exposed to a 900 FPM (feet per minute) air stream. If you have ever seen someone use a sling psychrometer, that is exactly what they are measuring (hopefully, you have a wrist that is well-calibrated to 900 FPM). The lower the wet-bulb compared to the dry-bulb (this differential is called wet-bulb depression), the lower the relative humidity and the greater the evaporative cooling effect.
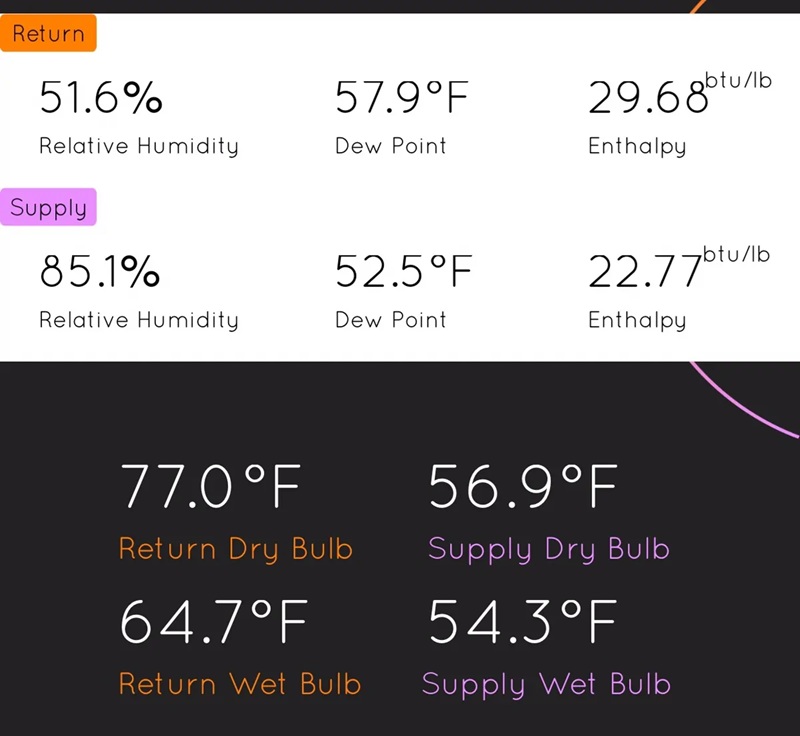
Enthalpy is the total heat content of the air and is represented in BTUs per lb of air, as you can see in the UEI HUB screenshot below.
By converting lbs of air to CFM, we can calculate the amount of heat in an air mass and the change in the enthalpy across a coil to calculate the heat moving capacity of a coil, BTU losses/gains over a length of duct, and much more.

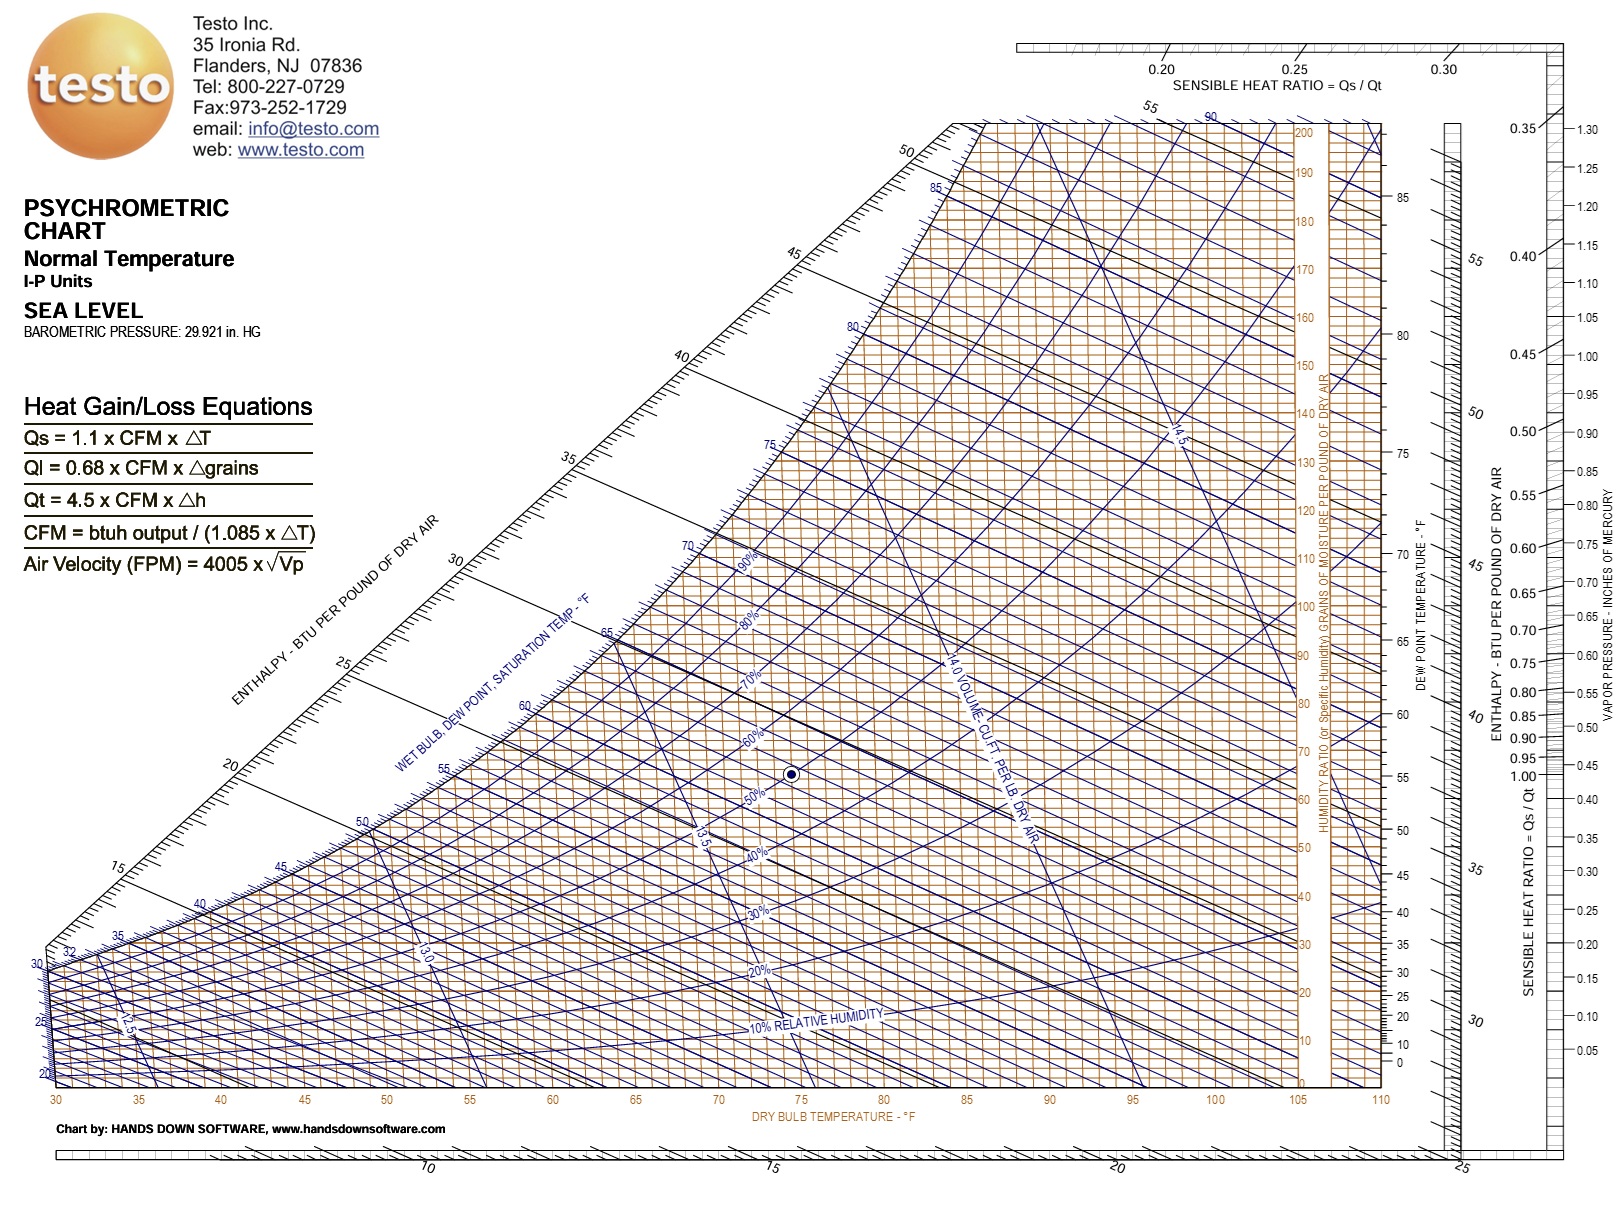
On a psychrometric chart, you will notice that wet-bulb temperature and enthalpy are slanted lines descending from left to right, and they are equivalent. This means that a particular wet-bulb temperature is also equal to a particular enthalpy (at 14.7 PSIA at least). In the chart above, you can see that a 62.8-degree wet-bulb mass of air contains approximately 28.4 BTUs per lb. The tricky part is reading at this extreme level of resolution because 28.4 vs. 28.6 can make a significant difference when it is multiplied out over a large air mass. This demonstrates why VERY accurate tools and careful calculations are required for enthalpy calculations in HVACR.
—Bryan
For a full WB Enthalpy calculator, go HERE and look for the enthalpy chart.
P.S. — If you're interested in diving into psychrometrics, Eugene Silberstein gave a great introduction to the topic on the podcast, which you can watch on video HERE. He also taught his “Psychrometrics Without Tears” class (based on his book of the same name) at this year's symposium. You can learn more about the symposium sessions and purchase a virtual ticket at https://hvacrschool.com/symposium and check out Eugene's book HERE.
 Related Tech Tips


Comments
Enthalpy and wet bulb lines are not parallel. Wet bulb at a high dry bulb will have a different enthalpy than the same wet bulb at a lower dry bulb.
Enthalpy and wet bulb lines are not parallel. Wet bulb at a high dry bulb will have a different enthalpy than the same wet bulb at a lower dry bulb.
To leave a comment, you need to log in.
Log In